
Open almost any trading platform's indicator list and Volume Profile and VWAP sit next to each other, usually under the same "volume" category. That grouping is reasonable — both are built from traded volume, and both are used to read where a market's activity is concentrated. But grouping them together also creates a quiet misunderstanding: traders start treating them as interchangeable, or as two versions of the same signal.
They are not. Volume Profile answers the question "at which prices did the market actually transact?" VWAP answers a different question: "what is the volume-weighted average price over this period, and where is the market relative to it?" One describes a distribution across price. The other describes a single reference line derived from that distribution. Confusing the two — or expecting one to do the other's job — is where most of the misuse starts.
This article separates what each tool measures, where each is genuinely more useful, how they complement each other in a single workflow, and the mistakes that show up most often when traders lean on them without a supporting process.
What Volume Profile Measures
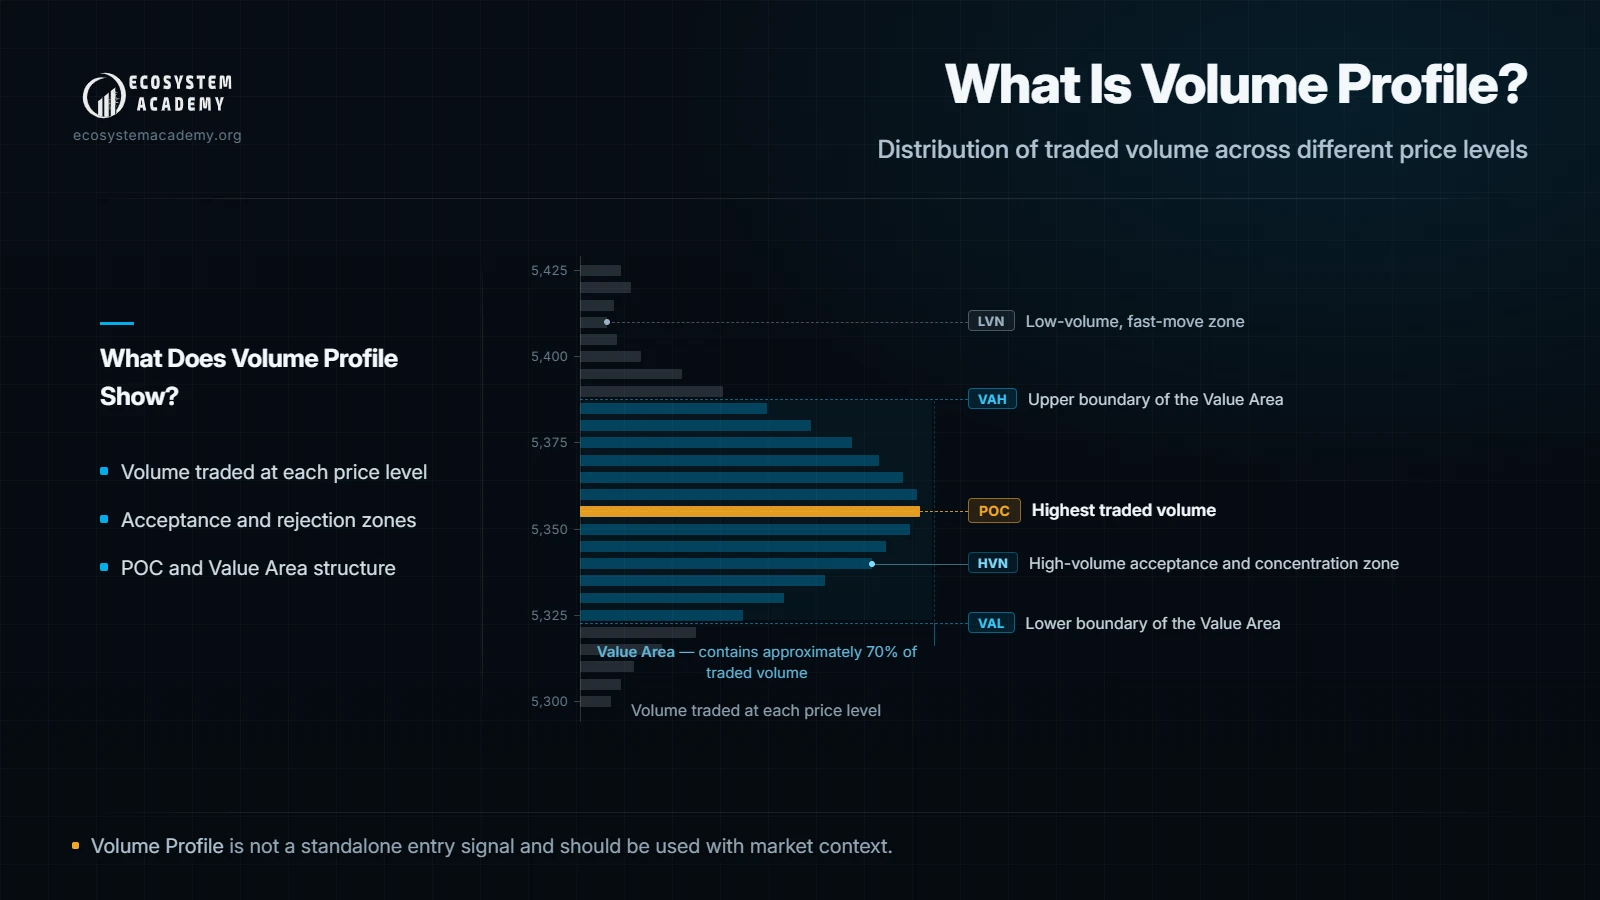
Volume Profile takes the volume traded during a period and distributes it along the price axis instead of the time axis. The result is a horizontal histogram: the longer the bar at a price, the more volume traded there.
If you have not read it yet, our introduction to Volume Profile covers the core vocabulary in more depth — POC, Value Area, and the common profile shapes. The short version:
- POC (Point of Control) — the single price level with the most traded volume in the profile. It marks the price where the market spent the most agreement.
- Value Area (VAH / VAL) — the price range containing roughly 70% of the profile's total volume, bounded above by the Value Area High (VAH) and below by the Value Area Low (VAL). This is the range where "most of the business" happened.
- HVN (High Volume Node) — a price shelf with heavy accumulated volume, where price has tended to slow down because both sides were actively transacting.
- LVN (Low Volume Node) — a thin, low-volume price area the market has tended to move through quickly, because little agreement existed there.
A price area with heavy volume is described as accepted: buyers and sellers transacted there repeatedly. An area the market passed through on low volume is described as rejected — not in the sense of a reversal signal, but in the sense that the market did not linger to build agreement there.
Profiles also come in two forms. A static (completed) profile covers a finished period — yesterday's session, last week, last month — and its POC and Value Area will not change. A developing profile is being built in real time during the current session; its POC and Value Area can and do shift as new volume prints, so a developing POC is a moving reference, not a settled one.
What VWAP Measures
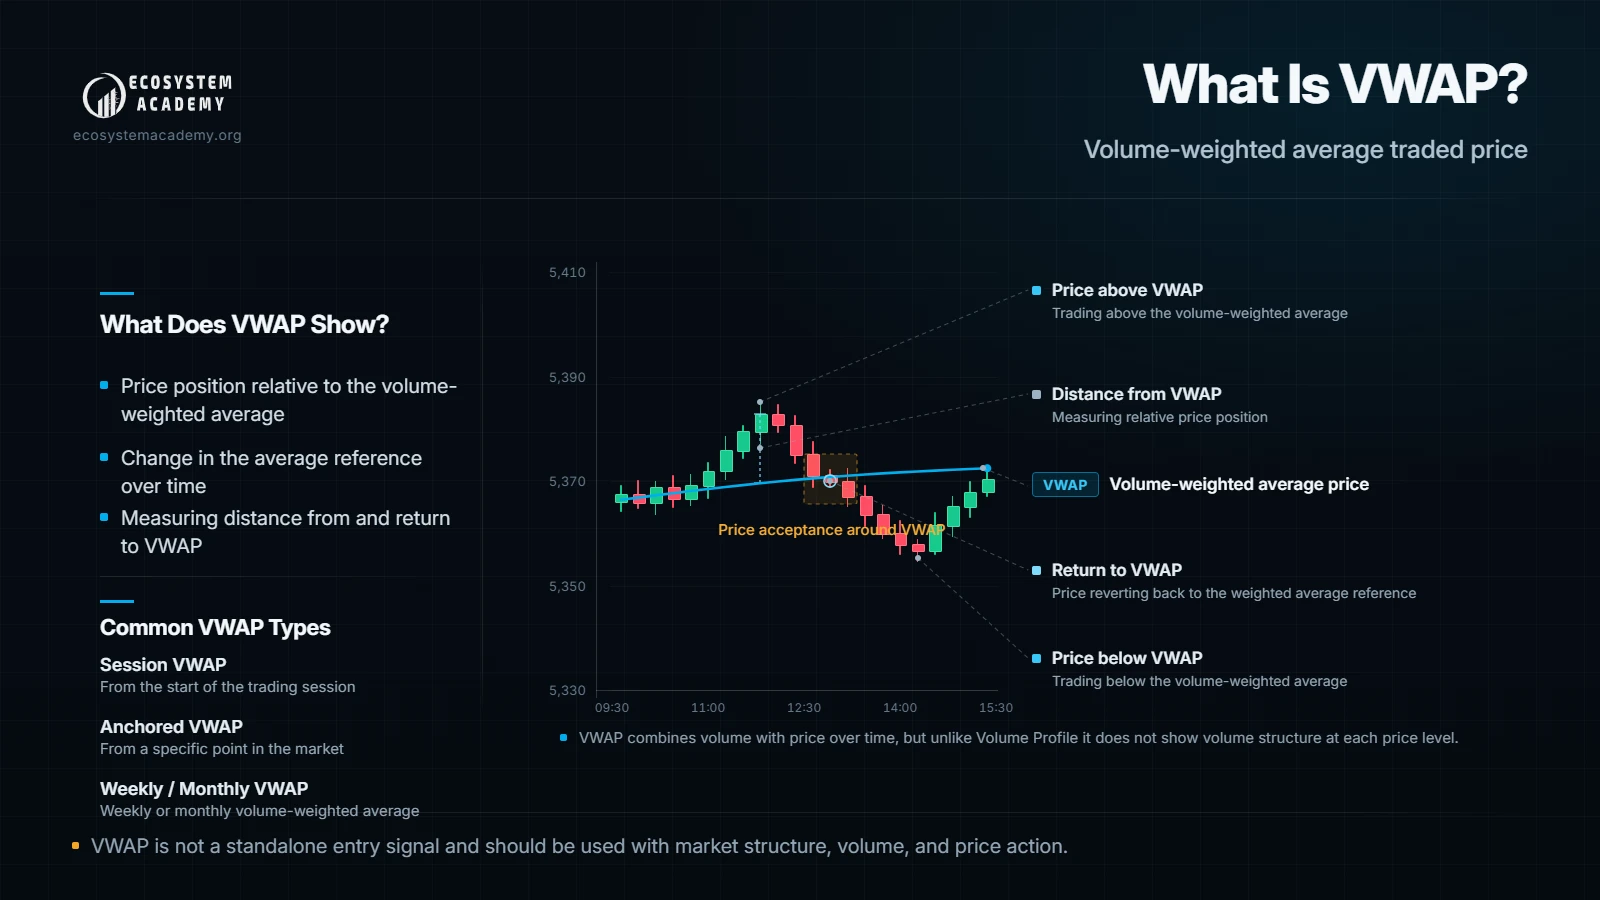
VWAP (Volume-Weighted Average Price) is the average price of every transaction in a period, weighted by the size of each transaction, calculated continuously from a chosen starting point. Unlike Volume Profile, it does not distribute volume across price — it collapses volume and price into one running number: a single line.
The starting point, or anchor, is what defines what a given VWAP means:
- A session VWAP resets at the start of each trading day and describes the average price traders have paid or received so far that session.
- A weekly or monthly VWAP anchors to the start of the week or month, describing a longer-run average.
- An anchored VWAP starts from any point the analyst chooses — a swing high, a swing low, an earnings date, a policy announcement — and describes the average price since that specific event.
Read as a mean-reversion reference: VWAP is where the "typical" trade of the period sits. Price above VWAP means participants who bought during the period are, on average, in an unrealized gain; price below it means the average participant is at an unrealized loss. That framing is also why VWAP carries real relevance for institutional execution — a large order is often benchmarked against VWAP because filling at or better than VWAP means the execution beat the period's average price. That is a description of how the benchmark is used, not a claim that VWAP predicts direction or that institutions defend it as a support or resistance level.
Core Differences
The two tools diverge on several dimensions worth naming explicitly:
| Dimension | Volume Profile | VWAP |
|---|---|---|
| What it shows | A full distribution of volume across price | A single volume-weighted average price |
| Output | Zones (POC, VAH, VAL, HVN, LVN) | One reference line |
| Underlying model | Auction structure — where agreement formed | Mean location — the period's average transaction price |
| Time context | Can be static (a completed period) or developing (live) | Always developing until the anchor period ends, then fixed |
| Sensitivity | Depends on the chosen period (session, week, composite range) | Depends heavily on the chosen anchor and period; a different anchor produces a materially different line |
The practical takeaway: Volume Profile gives you a map of where the market has done business. VWAP gives you a single coordinate — where price sits relative to the period's average. Neither is "better"; they answer different questions, which is exactly why combining them is more useful than picking one.
When Volume Profile Is More Useful
Volume Profile earns its place when the question is about structure and location within a range:
- Identifying value areas. Before a session opens, mapping the prior day's or prior week's VAH, VAL, and POC gives you a reference for where the market previously found agreement.
- Locating acceptance versus low-volume rejection. An HVN below current price is an area price may slow down near if it returns there; an LVN is an area price has historically moved through quickly, which is useful context when a fast move approaches one.
- Contextualizing range structure. A balanced, bell-shaped profile suggests a range-bound period; a P- or b-shaped profile suggests an advance or decline that stalled and built new acceptance at the extreme.
- Mapping likely decision zones. VAH and VAL, and the edges of an LVN, are natural places to watch for a reaction — not because the level guarantees one, but because that is where the market has historically had to decide whether to accept a new price or reject it.
When VWAP Is More Useful
VWAP earns its place when the question is about location relative to the period's average and near-term flow:
- Determining location relative to the average. Is the current price meaningfully above, below, or hugging the session's VWAP? That single fact frames whether the current move is extended relative to the period's typical trade.
- Assessing reclaim or rejection behavior. Price crossing back above VWAP after trading below it (a reclaim) or failing to hold above it (a rejection) describes a shift in which side of the average is currently in control.
- Intraday and session context. Session VWAP is the standard reference for "where are we relative to today's average," which is a different and often more immediate question than "where is the multi-day Value Area."
- Evaluating extension from the mean. The further price trades from VWAP, the more extended the current move is relative to the period's average — useful context for judging whether a move is stretched, independent of any prediction about what happens next.
Combining Volume Profile and VWAP: A Workflow
Used together, the two tools support a structured reading of the market rather than two competing signals. A disciplined sequence looks like this:
- Start with higher-timeframe context. Before either tool matters, establish the broader trend or range on a higher timeframe — Volume Profile and VWAP describe location, not direction, so direction has to come from somewhere else first.
- Map prior and developing profile levels. Mark the previous session's or previous range's POC, VAH, and VAL, and note where the current session's developing profile is building its own POC.
- Identify current location relative to VWAP. Note whether price is above, below, or near the session (or anchored) VWAP.
- Classify the location. Ask whether price is inside the Value Area, outside it, extended away from VWAP, reclaiming VWAP from below, or being rejected from above — this single classification step does most of the analytical work.
- Require price action or order-flow confirmation. Neither tool is an entry trigger on its own. A location worth watching still needs confirming behavior — a slowdown, an absorption, a clear rejection candle — before it becomes a decision point.
- Define invalidation and risk before execution. Decide in advance what would prove the read wrong, and size the position accordingly. This step is not optional; it is what turns a structural observation into a managed decision.
Traders building this habit systematically, rather than reading levels ad hoc, often find it useful to practice the sequence inside a structured curriculum such as the Academy's technical analysis course.
Practical Scenarios
The table below illustrates a few common location combinations. Each description states what the situation may indicate — never what it proves.
| Scenario | What it may indicate | What it does not prove |
|---|---|---|
| Price above VWAP and above VAH | The market is trading above both its average and its prior value range — a sign of relative strength for the period | That the move will continue, or that a pullback is due |
| Price above VWAP but inside the Value Area | The average participant is in a gain, but the market has not yet left its established range | That the range is about to break |
| Price below VWAP, near VAL | The average participant is at a loss, and price is testing the lower edge of prior acceptance | That VAL will hold, or that it will fail |
| VWAP crossing through POC | The period's average price and the prior period's most-traded price currently coincide | That this coincidence is itself a signal — it is a reference alignment, not an event |
Common Mistakes
Most misuse of these two tools falls into a short list of recurring habits:
- Treating VWAP as automatic support or resistance. VWAP is an average, not a level defended by design. Price crosses it constantly, and the crossing itself is not an event.
- Treating every POC touch as a trade. A POC describes where volume concentrated in the past, not a rule that price must react there again.
- Mixing incompatible sessions or periods. Comparing a session VWAP to a monthly Value Area, or a daily POC to a three-month range, treats two different things as one.
- Ignoring market regime. Value Area and VWAP behavior read differently in a balanced, range-bound market than in a trending one.
- Using the tools without confirmation. A level or a VWAP relationship is context, not a trigger, without separate price-action or order-flow confirmation.
- Overfitting anchors. Repeatedly moving an anchored VWAP's start until it "confirms" a bias defeats the purpose of anchoring it to a meaningful event.
A Practical Checklist
Before treating either tool as part of a trading decision, it can help to run through a short checklist:
- Have you established higher-timeframe context first?
- Do you know which period produced the profile levels you are reading (session, week, composite)?
- Do you know which anchor produced the VWAP you are reading?
- Is price inside the Value Area, outside it, or extended from VWAP — and can you state which?
- Have you looked for separate price-action or order-flow confirmation, rather than acting on the level alone?
- Have you defined invalidation and position size before entering, not after?
Neither Tool Is a Complete System
Volume Profile and VWAP are, on their own, descriptive statistics — one distributes volume across price, the other collapses volume and price into a single average. Neither forecasts, neither guarantees a reaction, and neither replaces a trading plan. Their real value shows up only inside a broader process: established market context, clear definitions of the period each tool describes, confirmation from price action or order flow, and risk defined before the fact rather than after.
This article is educational content only. It does not constitute financial advice, a trading signal, or a guarantee of any outcome, and trading involves the risk of loss.
If you want to build this workflow with the platform tools these examples reference, our TradingView setup guide walks through the practical plotting of VWAP and Volume Profile, and the Academy's mentorship program offers structured guidance for traders who want to practice this process rather than read about it once.